Data
Synthetic Populations |
||
|
|
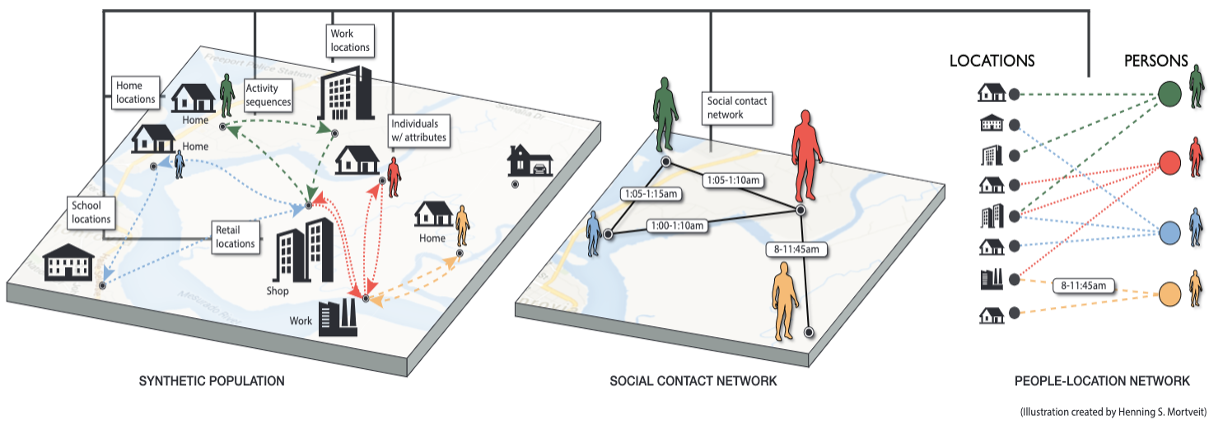
Synthetic populations for regions of the World (SPW) is a collection of data sets, each data set being a synthetic population for a country, or state, both of which will be referred to as a region in the following. At a high level, a synthetic population of a region as provided here captures the people of the region with selected demographic attributes, their organization into households, their assigned activities for a day, the locations where the activities take place, and thus where interactions among population members happen (e.g., spread of epidemics). | |
|
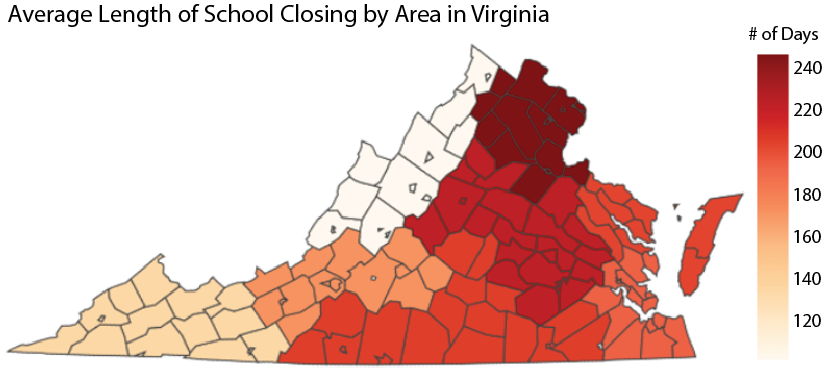
The methodologies used to create these datasets were also used to generate two synthetic population datasets for the UK-US Privacy-Enhancing Technology challenge. The challenge is focused on accelerating the adoption and development of privacy-enhancing technologies (PETs): Transforming financial crime prevention and boosting pandemic response capabilities through privacy-preserving federated learning. Our team has generated the two synthetic population datasets provided in the Pandemic Response Challenge. The first covers the population of the UK, and the second the population of the state of Virginia, USA. We used an outbreak simulation that created 63 days-worth of data, subsequently split into 56 days of training data and 7 days of test data. Find the technical report discussing this here. |
Open Graph Benchmark |
|
|
|
|
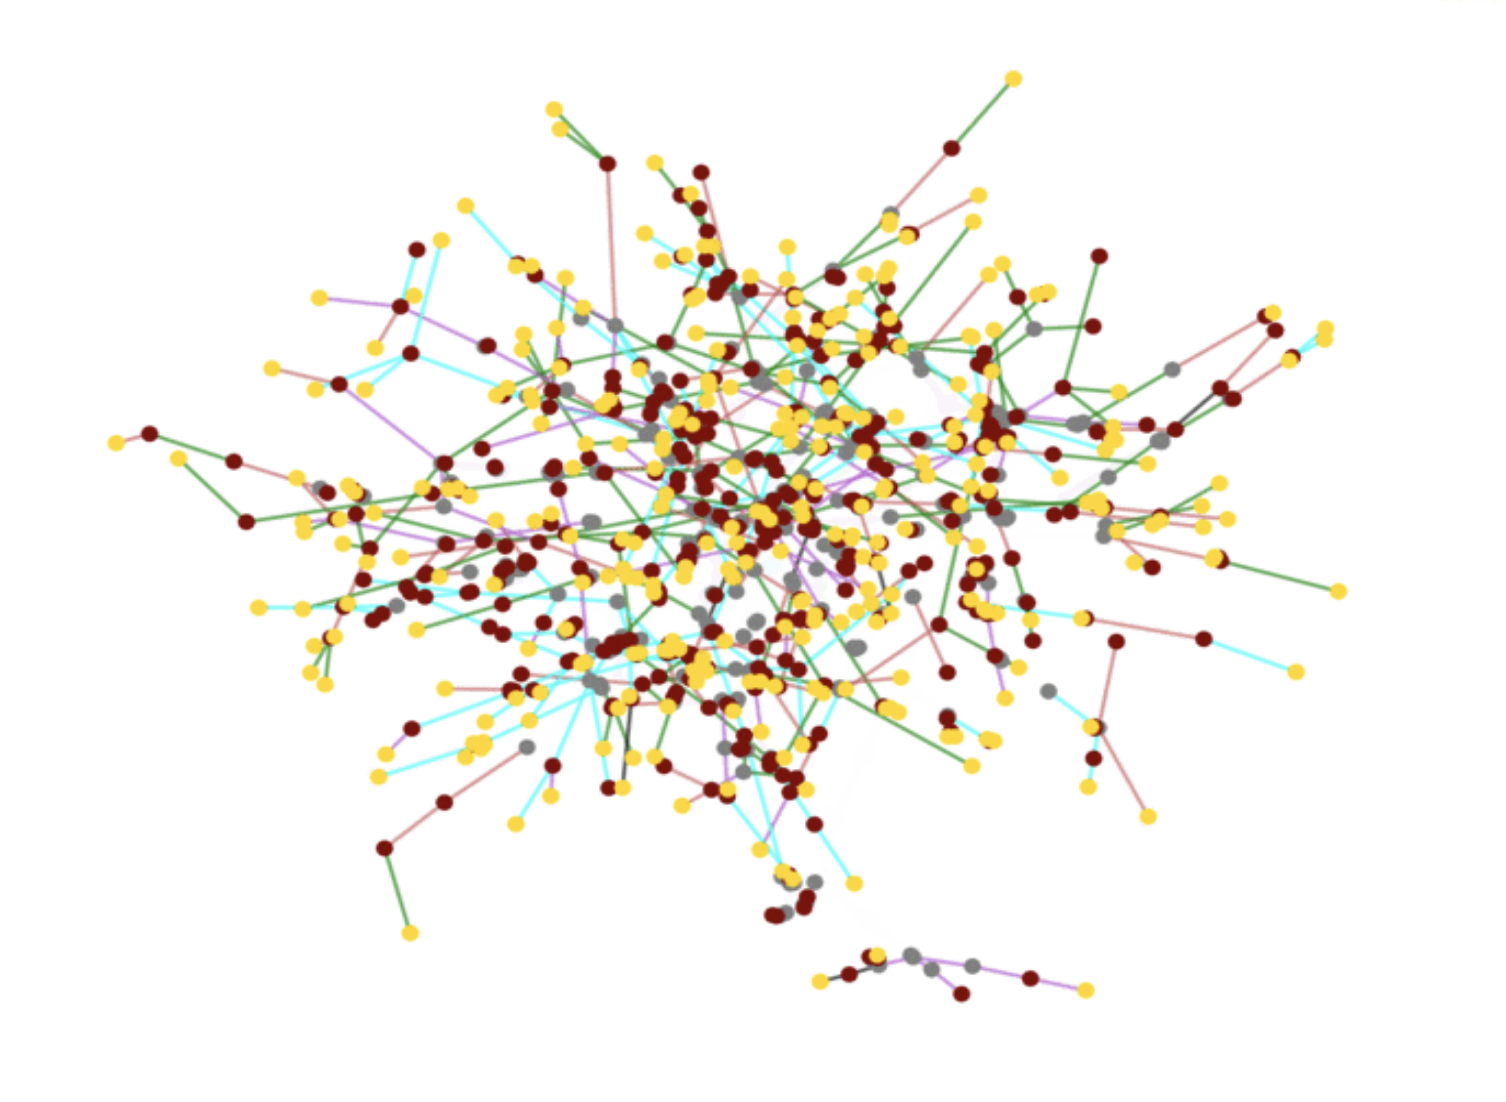
The Open Graph Benchmark (OGB) is a collection of realistic, large-scale, and diverse benchmark datasets for machine learning on graphs, many. of them from the biomedical domain. The site includes the datasets, the code to run baseline algorithms, and a leaderboard. OGB is a community-driven initiative in active development. We expect the benchmark datasets to evolve. To keep up to date with major updates, subscribe to our google group here. |
|
Global PatchSim Dataset |
||
|
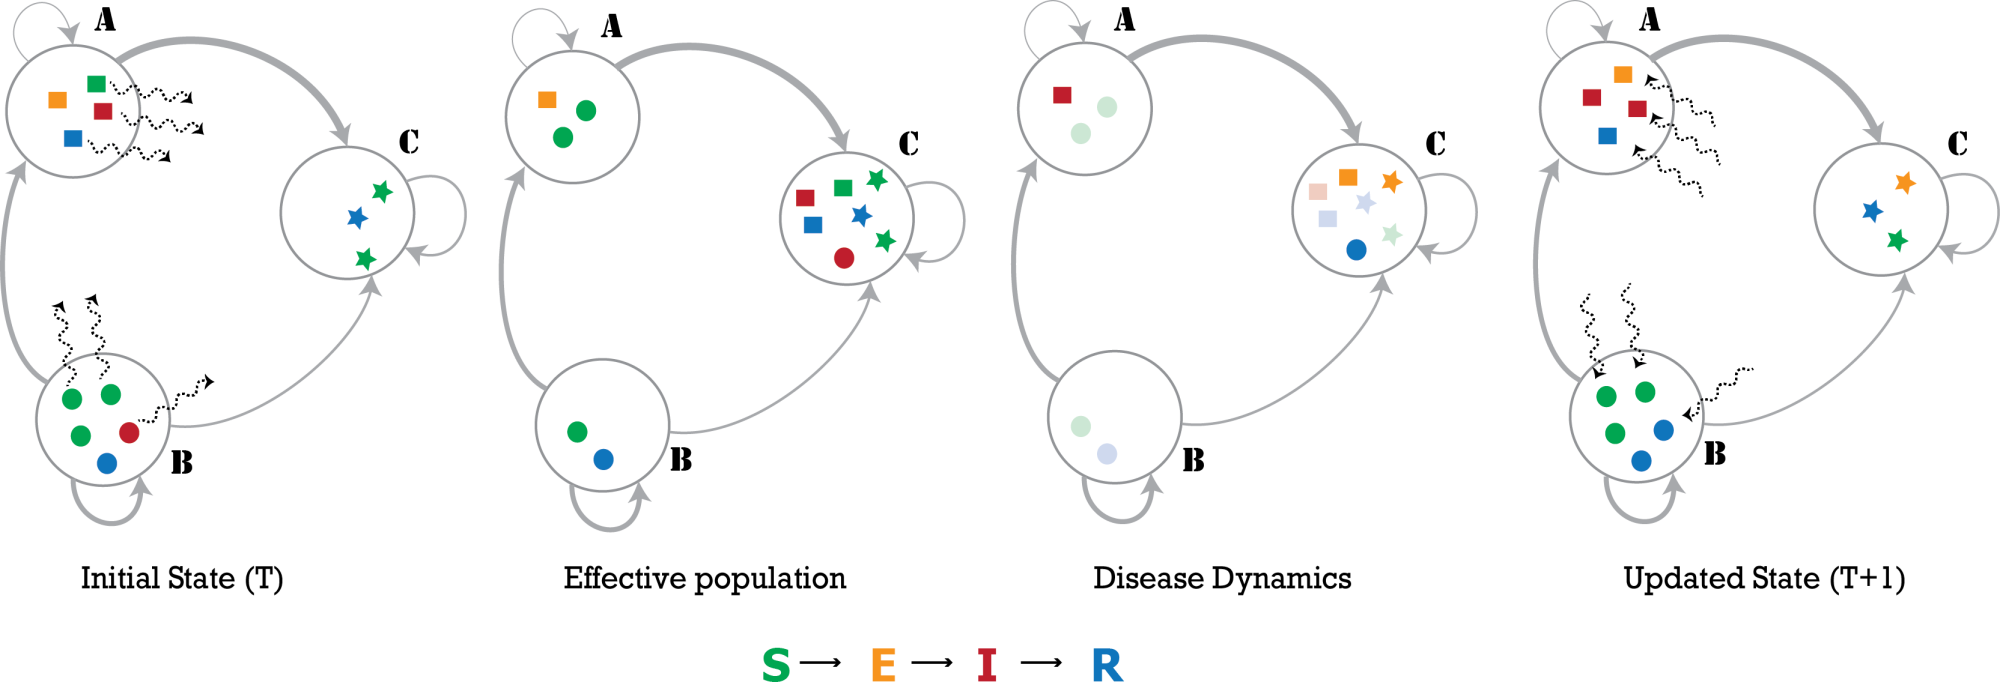
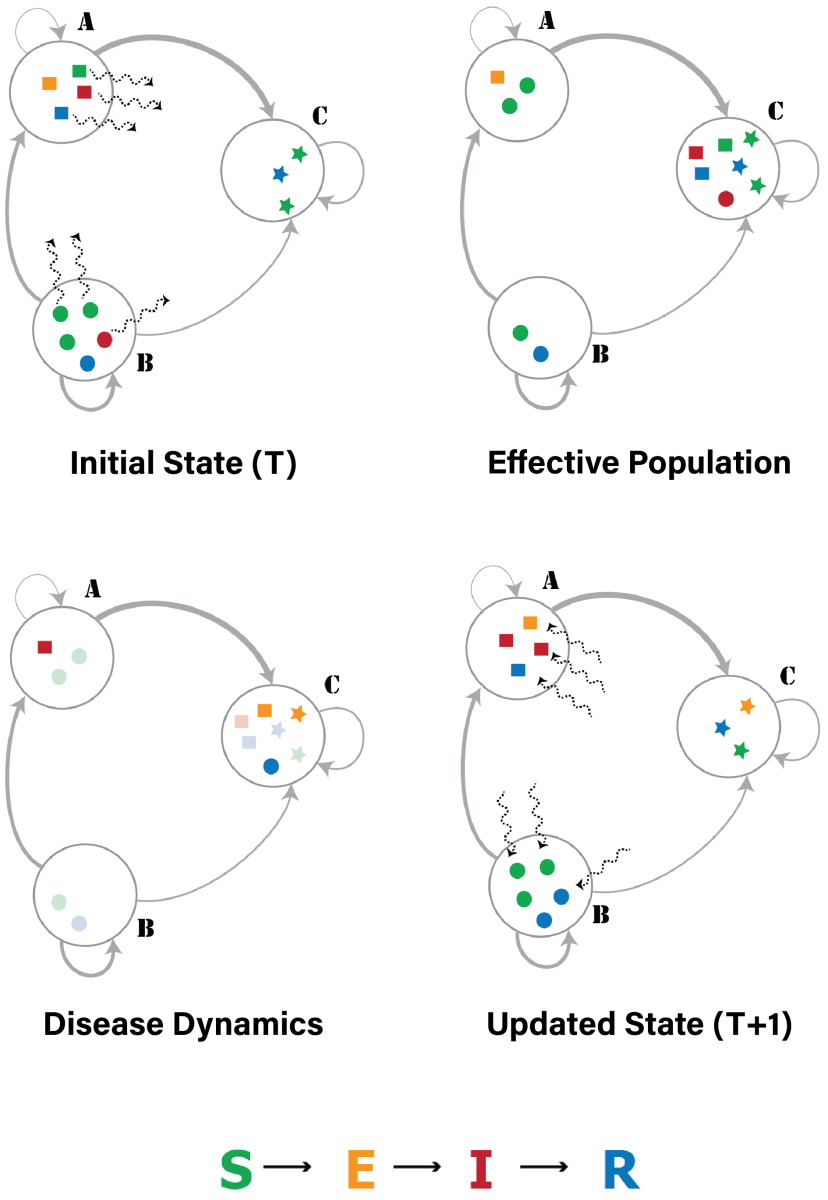
PatchFlow is a set of pre-calculated networks for simulating the meta-population SEIR model at a global level. For the current version, using openly available datasets on population sizes [1] at the resolution of administrative regions (admin2 and admin3) [2] and age mixing matrices [3], we construct country-specific mobility networks based on a radiational model [4,5]. These networks are constructed to be compatible with the open-source meta-population simulation engine, PatchSim [6]. For more information, see below (in Tools). This project is supported by the National Science Foundation under the NSF RAPID: COVID-19 Response Support: Building Synthetic Multi-scale Networks (PI: Madhav Marathe, Co-PIs: Henning Mortveit, Srinivasan Venkatramanan; Fund Number: OAC-2027541). |
 |
|
 |
Virginia County-level NPIs |
|
|
The team at Network Systems Science and Advanced Computing (NSSAC) Division of the Biocomplexity Institute and Initiative (BII) at the University of Virginia gathered data on non-pharmaceutical interventions (NPIs) against COVID-19 from counties and independent cities in Virginia. NPIs are methods for reducing the spread of a disease that do not involve vaccines or drug treatments. Specifically, we look for dates when closures or mandates were implemented or lifted in the following five categories: masks, businesses, pre-K-12 schools, colleges, and religious organizations. |
Baidu Mobility Data for January - April 2020 |
 |
|
|
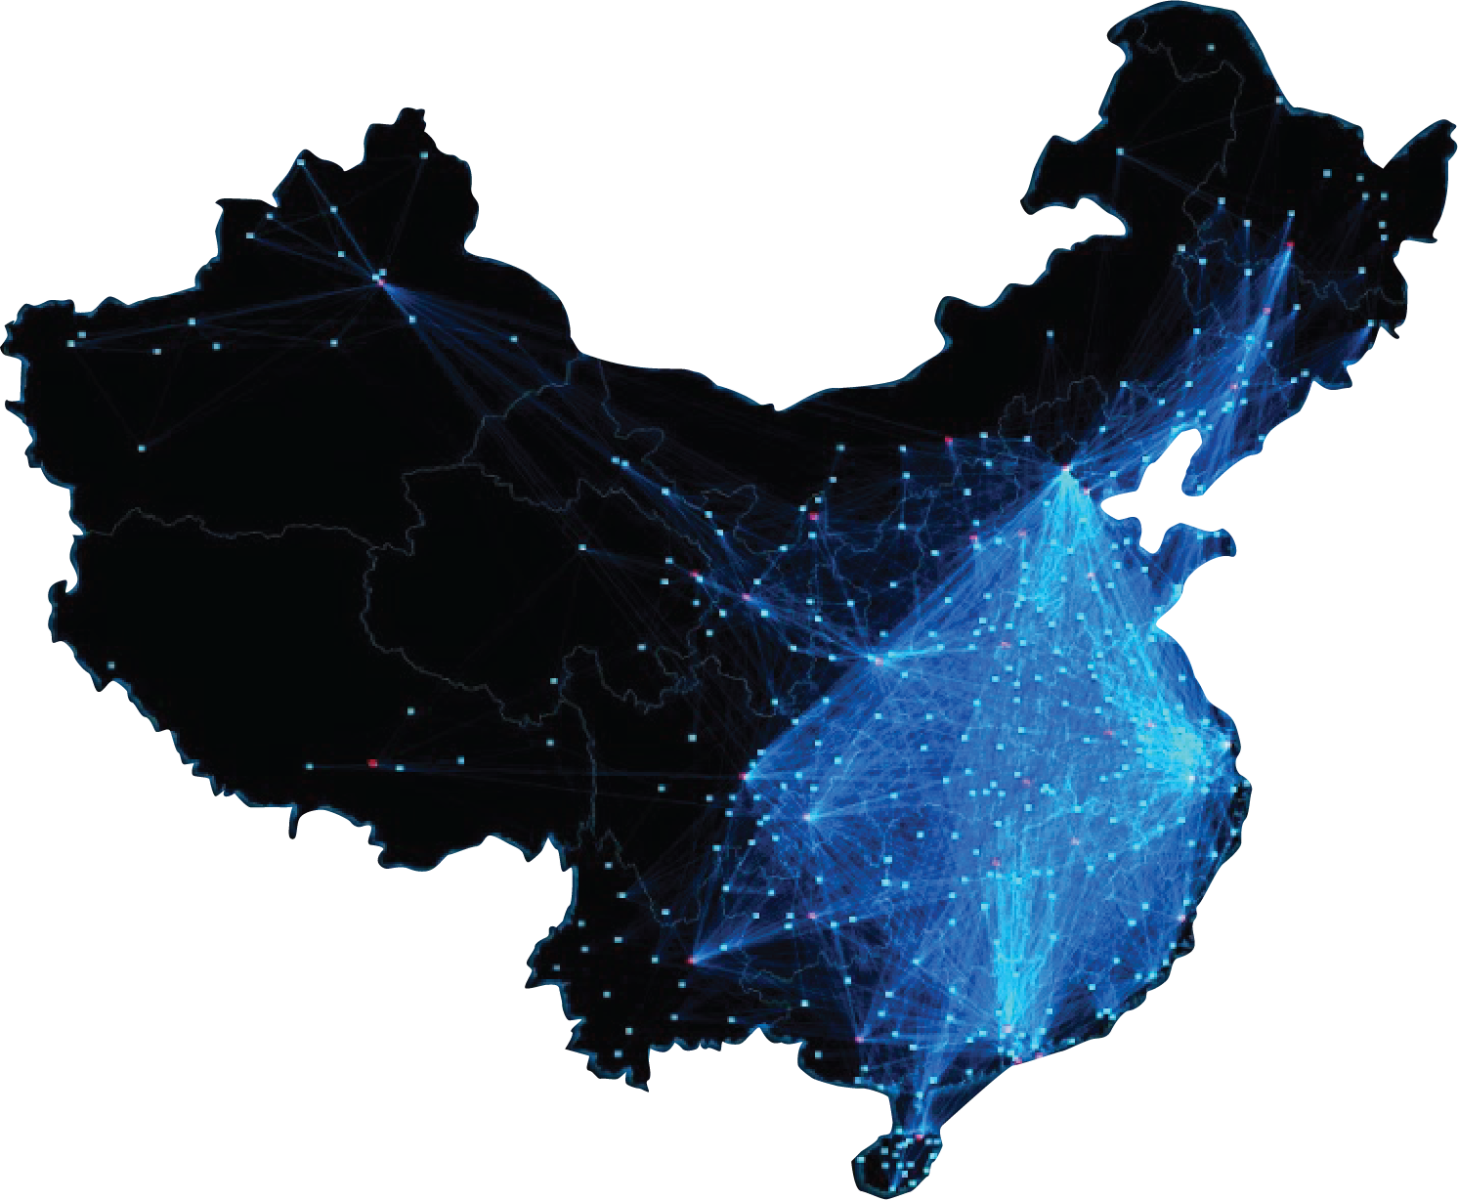
This archive contains mobility data made public by Baidu and scraped from their qiangxi.baidu.com website in February and March 2020. We have reformatted the data into a more easily computable form, comma-separated value (.csv) files providing the full origin-destination matrix for each day. We are publishing this reformatted version for research purposes under Article 22 of the Copyright Law of the People’s Republic of China. We make no representation as to the suitability of the data for any purpose but nevertheless hope that it may be useful for researchers trying to calibrate models of 2019-nCov. We wish to thank Baidu especially for making these valuable data available and encourage them to continue to do so. Thanks also to Chunhong Mao for making us aware of this data source and explaining what the data represent and to James Schlitt for scraping the data. |
Tools
COPASI: Biochemical System Simulator |
||
|
COPASI is a software application for the simulation and analysis of biochemical networks and their dynamics. COPASI is a stand-alone program that supports models in the SBML standard and can simulate their behavior using ODEs or Gillespie’s stochastic simulation algorithm; arbitrary discrete events can be included in such simulations. You can visit the COPASI Simulator here. |
 |
dismolib |
|
|
dismolib is an interactive library for simulating the numerical outcomes of published mathematical epidemiology models including two types of COVID-19 models. For a disease model in this library, you can vary the parameters, simulate the time course, perform stability analysis, and more. Start using dismolib here. |
| |
Net.Science |
|
|
Net.Science is a cyber-infrastructure for network science and engineering. It is a community-driven resource, bringing together producers (contributors of software, data, and learning materials) and users. Our goal is to attract individuals and groups from industry, applied R&D and government laboratories, educators, college and university students (including undergraduates) across academic disciplines, and high school students. Start using Net.Science by clicking here. |
 |
PyG |
|
|
PyG is one of the most popular open source libraries for Graph Neural Networks. It is built upon PyTorch to easily write and train Graph Neural Networks for a wide range of applications related to structured data. PyG is both friendly to machine learning researchers and first-time users of machine learning toolkits. The website contains links to the source code, documentation, the Slack workspace, and other project-related infromation. |
 |
EXCEADS |
|
|
EXCEADS: EXperiments in Computational Epidemiology for Action and Decision Support is an application that allows the design, execution, and analysis of computational epidemiology experiments. The user is able to simulate the spread of infectious diseases under different initial conditions and intervention strategies to better understand disease dynamics to inform actions and support decisions. The interface walks the user through the design of these experiments, allows the execution of complex full-factorial experiments with the press of a button, and provides summary reports and plots as well as access the model results through an easy-to-use web application. Get ready to simulate! |
 |
BACTERIAL AND VIRAL BIOINFORMATICS RESOURCE CENTER |
|
|
The Bacterial and Viral Bioinformatics Resource Center (BV-BRC) is an information system designed to support research on bacterial and viral infectious diseases. Use the BV-BRC by clicking here. |
 |
PatchSim |
|
|
We have developed a national-scale metapopulation model for the spread of influenza by integrating both local and long-distance mobility data. For the example below, we combined data on commuter mobility from the American Community Survey (ACS) with domestic airline passenger data from the Bureau of Transportation Statistics (BTS) to capture human mobility across the country. Next, we adopted a metapopulation approach to simulate epidemic spread at the spatial resolution of counties (patches) wherein the temporal travel matrix is used to represent the flow of people between these patches: PatchSim.
PatchSim can be used in modeling a variety of situations. Click the links below to learn about: The associated PatchFlow datasets can be found above in the Data section. |
 |
EpiHiper |
|
|
EpiHiper is a parallel agent-based socio-epidemic simulator. In a distributed network-based stochastic disease transmission simulation, it allows you to assess the impact on transmission under different conditions and assess the impact of contact tracing. |
Dashboards
 |
COVID-19 Surveillance Dashboard |
|
|
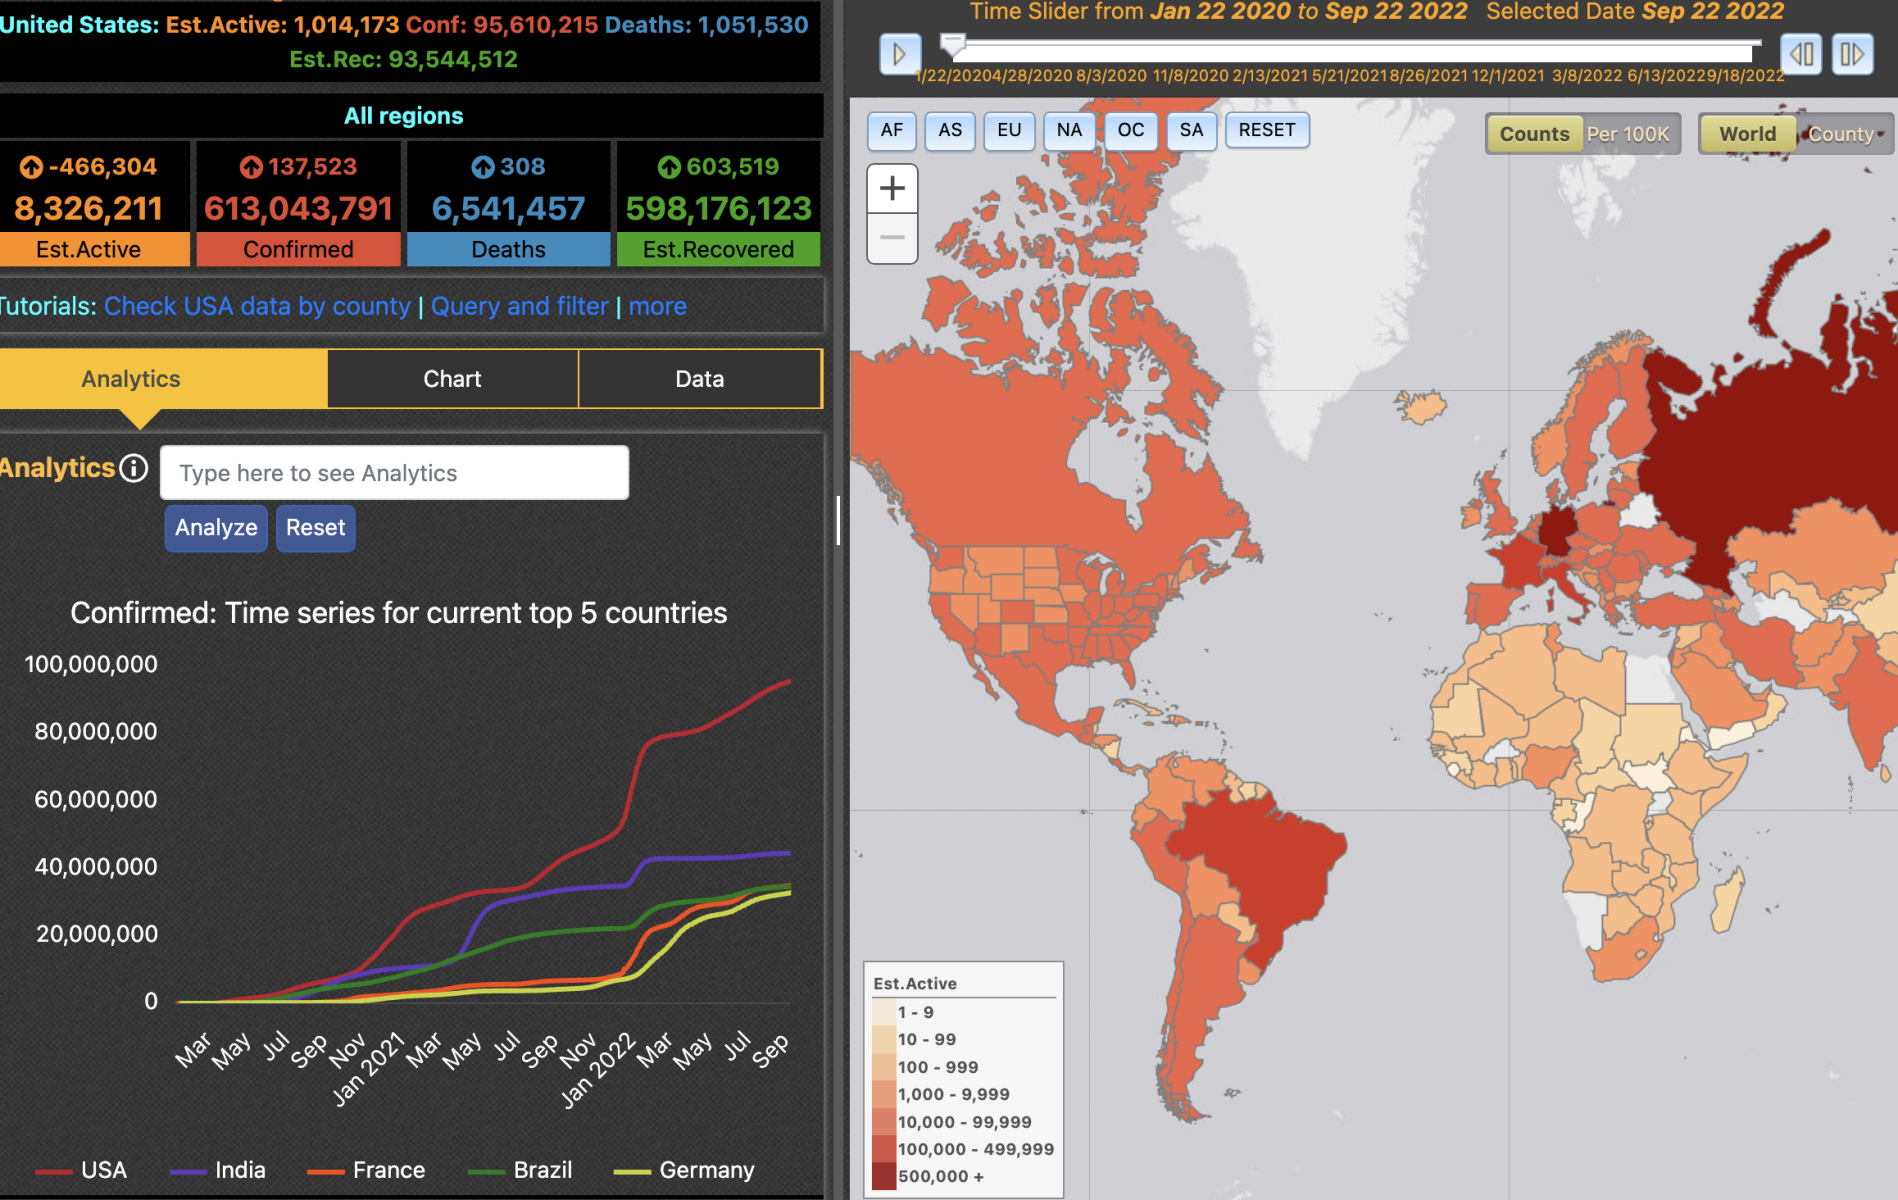
In an effort to support the planning and response efforts for the COVID-19 pandemic, we have prepared a visualization tool that provides a unique way of examining data curated by different data sources. You can visit the COVID-19 Surveillance Dashboard here, or learn more about it here. |
 |
Virginia Medical Resource Demand Dashboard |
|
|
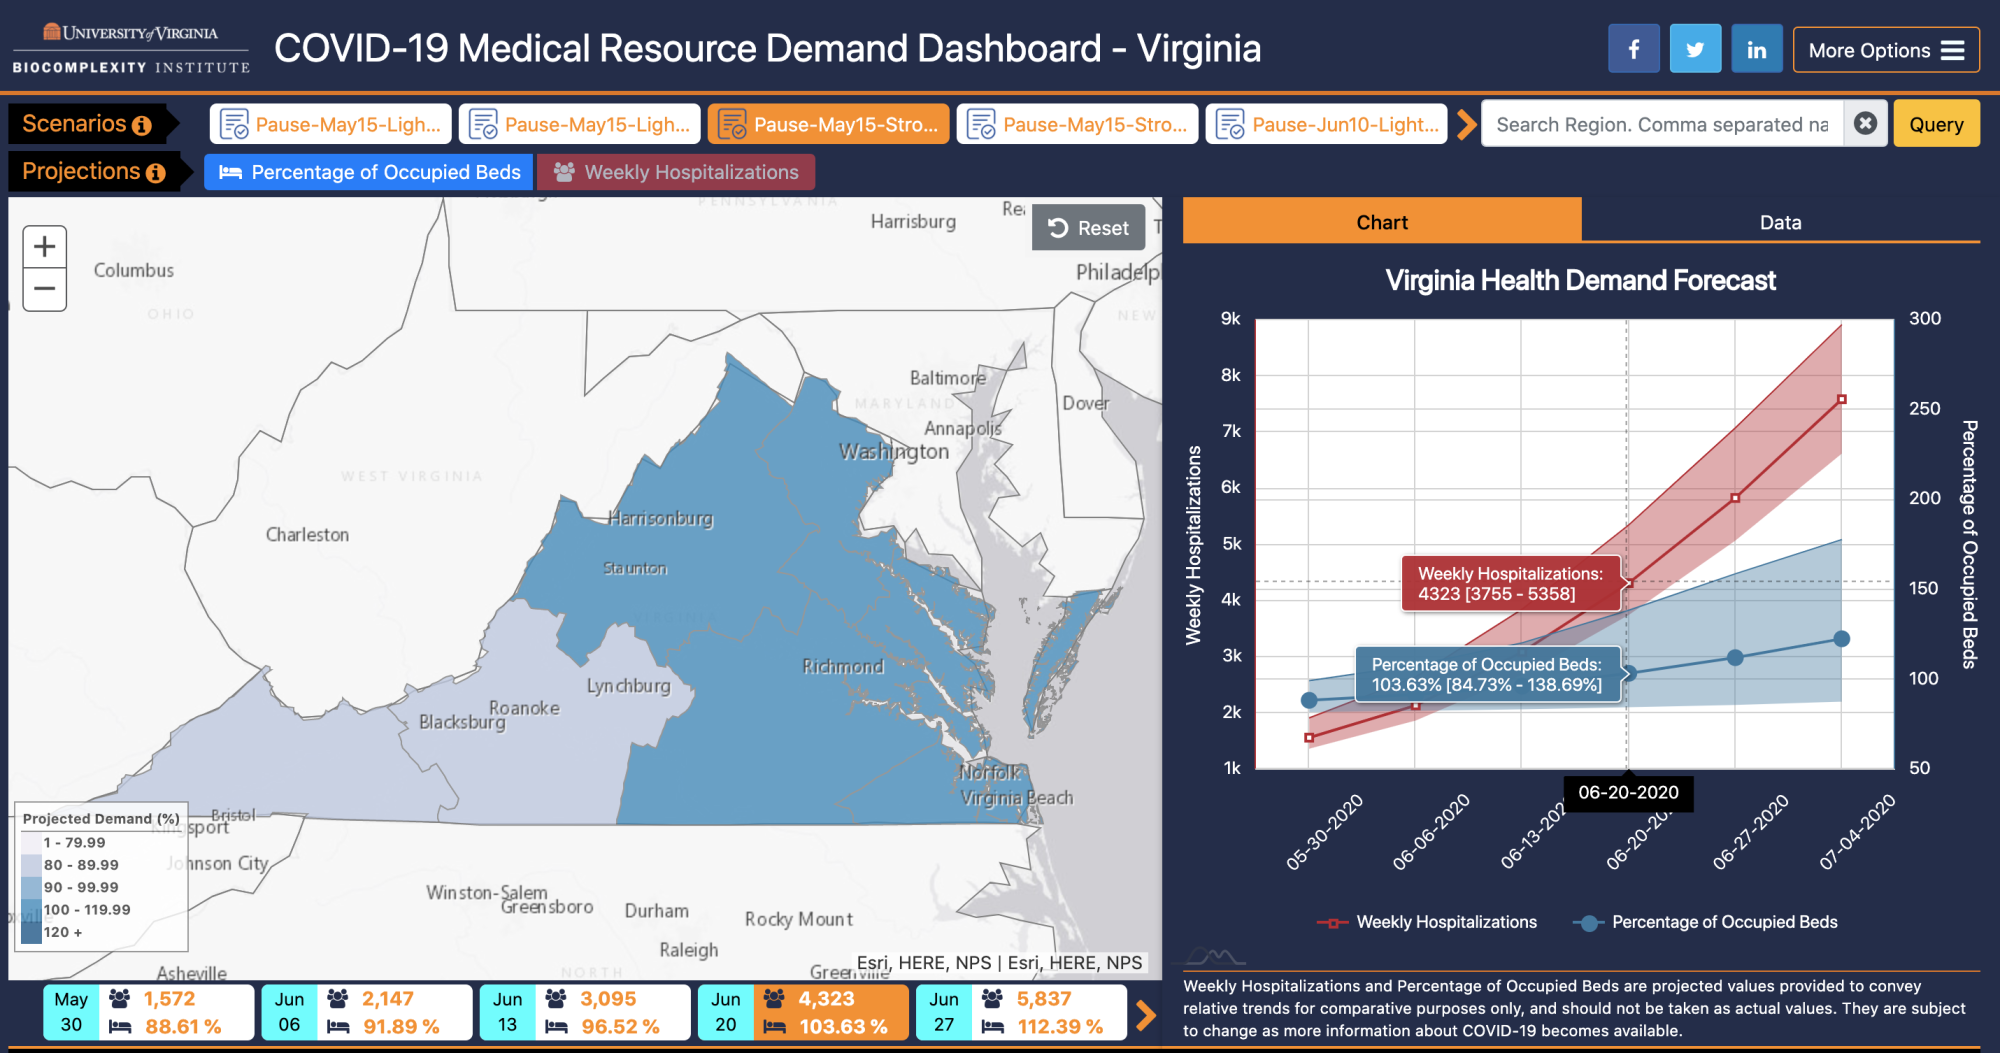
The Virginia Medical Resource Demand Dashboard is a visualization tool that couples epidemic simulations produced by NSSAC with hospital resource counts to project when different Virginia Hospital Preparedness Program (VA HPP) regions (also called Virginia Hospital Alerting & Status System (VHASS) regions) might hit the crisis stage due to the COVID-19 pandemic. You can visit the dashboard here, or learn more about it here. |
 |
US Medical Resource Demand Dashboard |
|
|
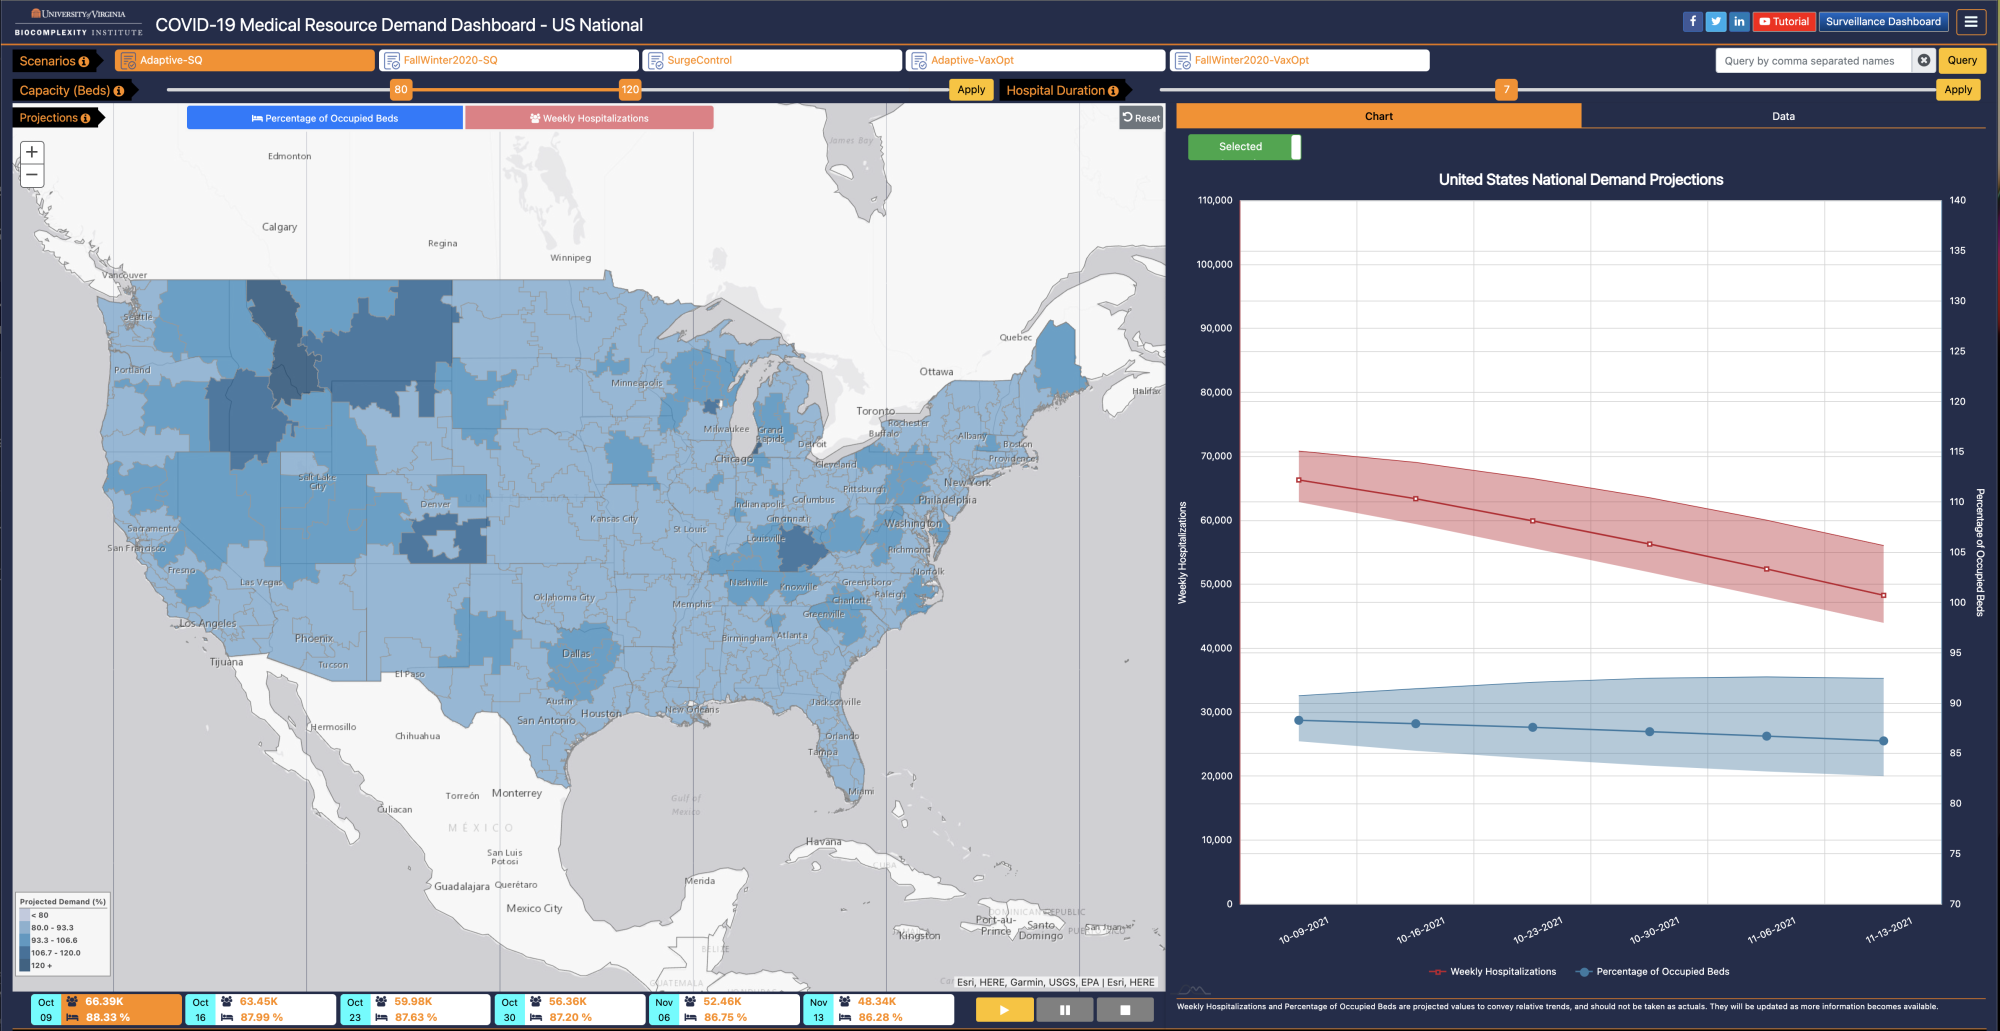
One major concern as the pandemic got underway was whether hospitals could handle the influx of COVID-19 patients. The US Medical Resource Demand Dashboard was developed to allow public health officials to identify where and when hospitalizations are likely to peak. You can visit the dashboard here, or learn more about it here. |
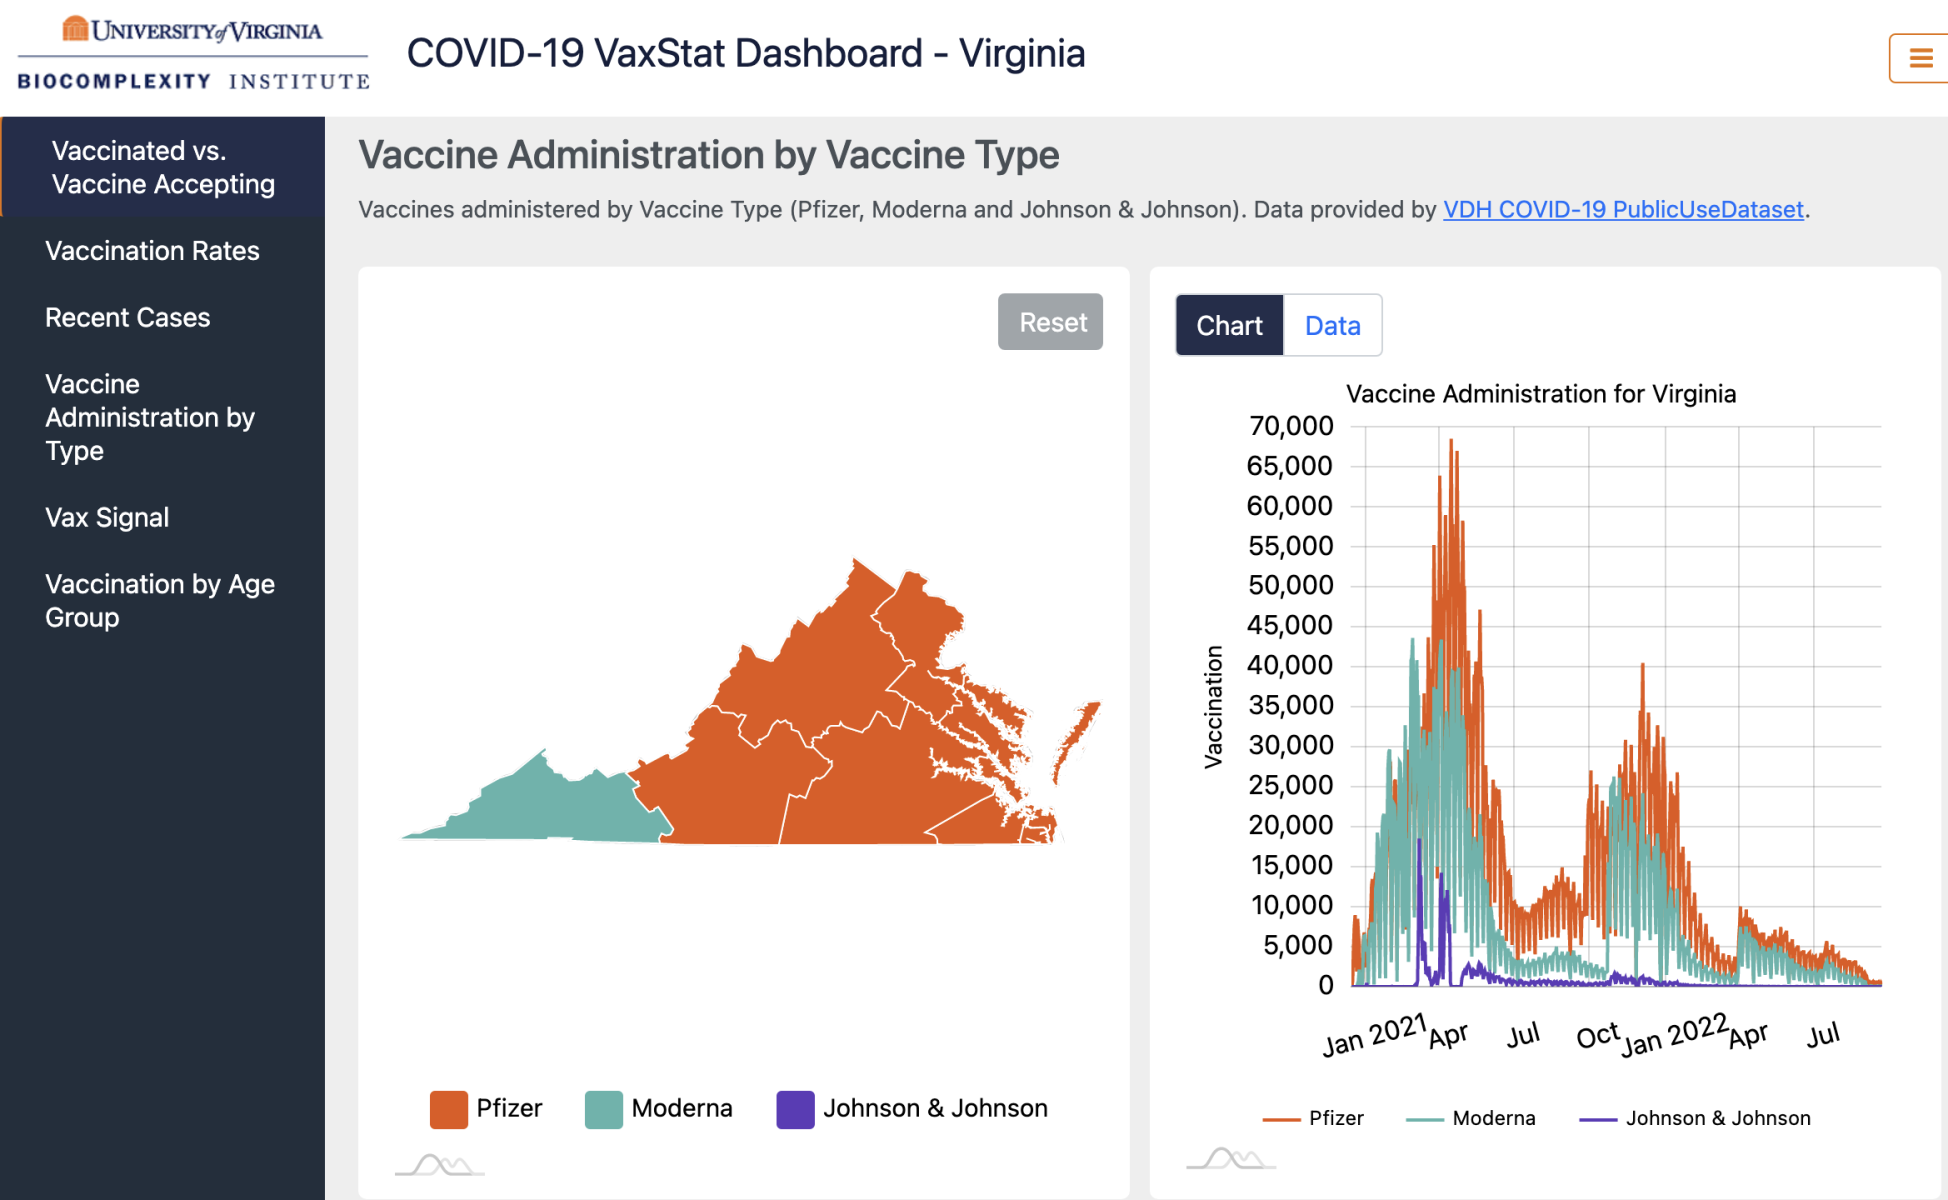 |
Virginia COVID-19 VaxStat Dashboard |
|
|
The VaxStat Dashboard is a platform for sharing our insights on Vaccine Deployment and Acceptance. The framework is developed to streamline the processing of adding new datasets, as well as to simplify the comparison of different datasets. You can visit the dashboard here. |
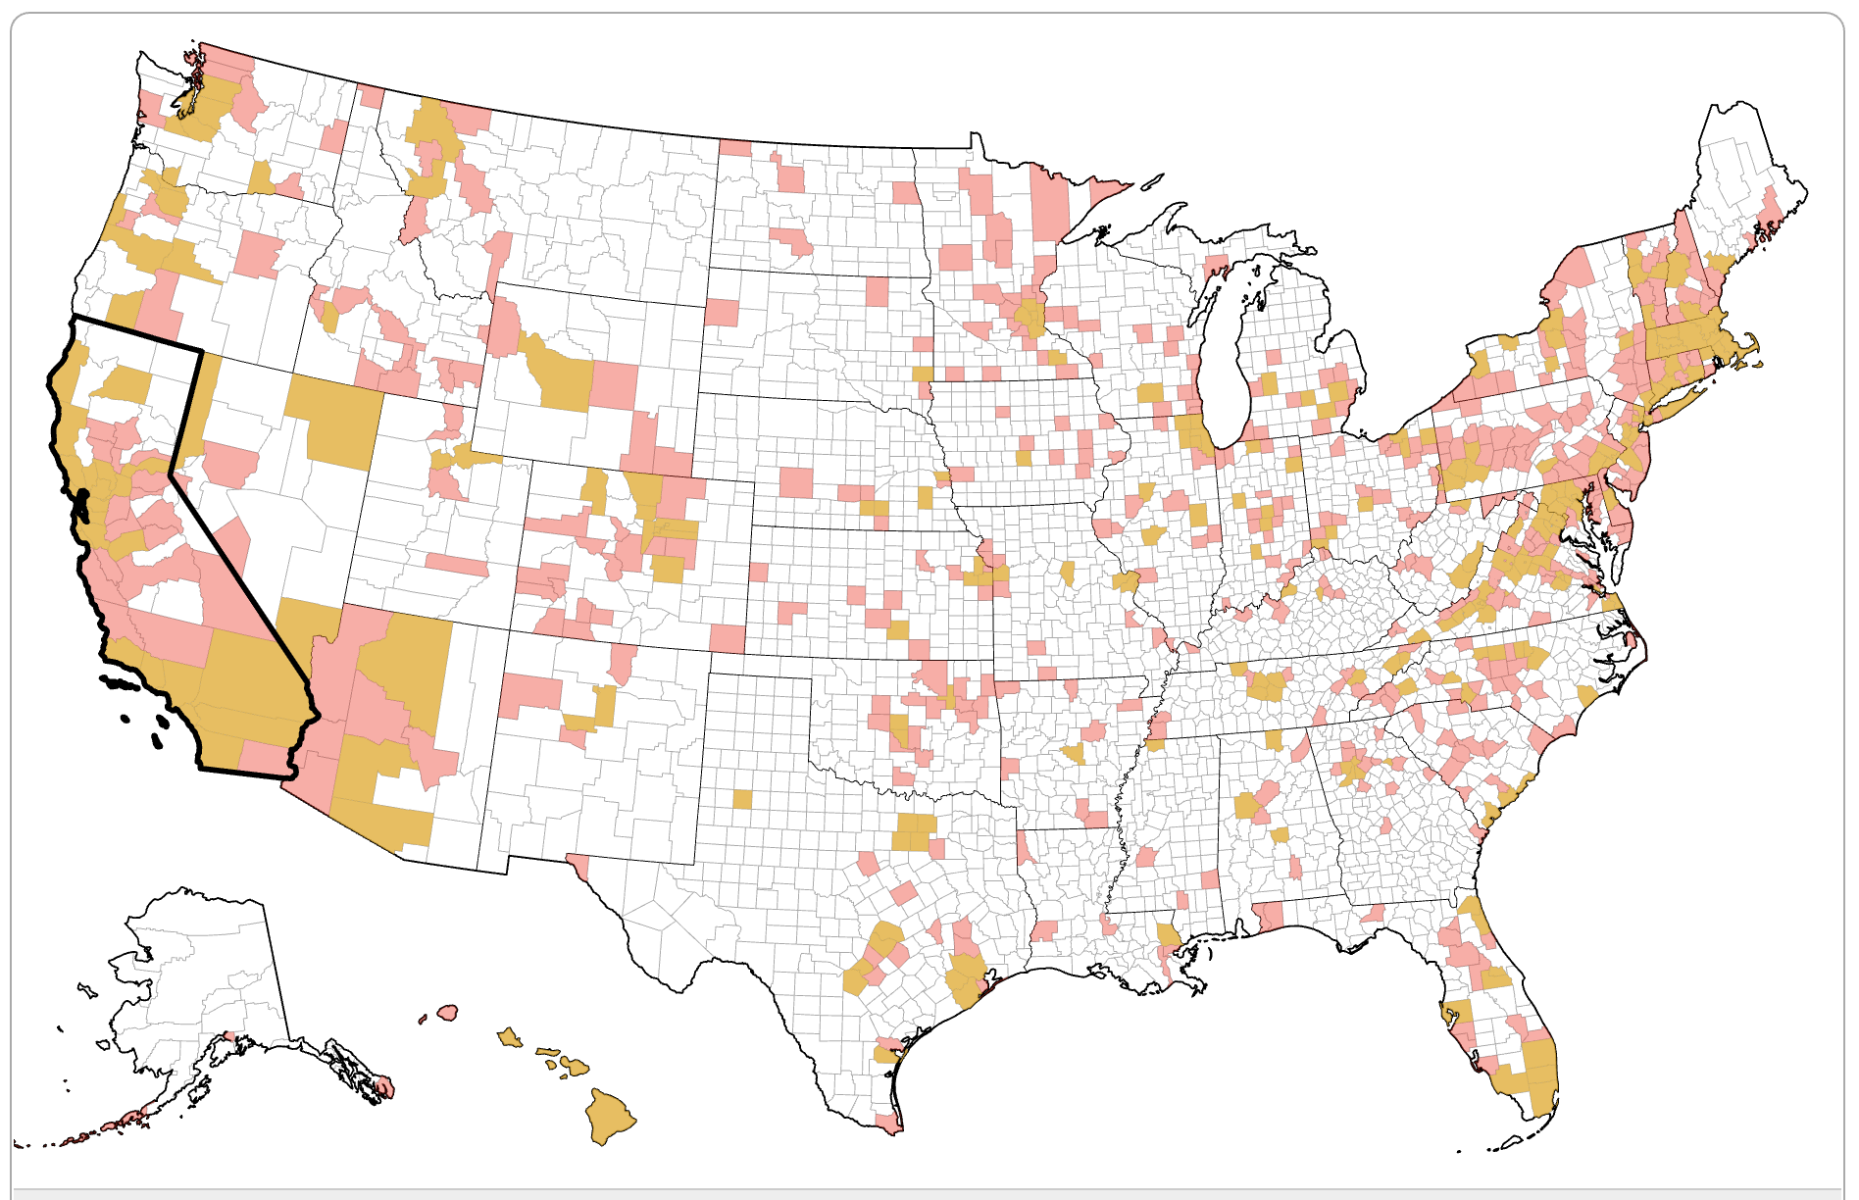 |
Social Distancing Dashboard |
|
|
Leading epidemiologists are assisting the CDC and other federal and state agencies to develop computational models of how COVID-19 might spread in your community. These models depend on knowing the different social distancing measures in each of the 3000+ counties in the United States. We urgently need volunteers to help us build a dataset of social distancing measures. You can visit the Social Distancing Dashboard here. |
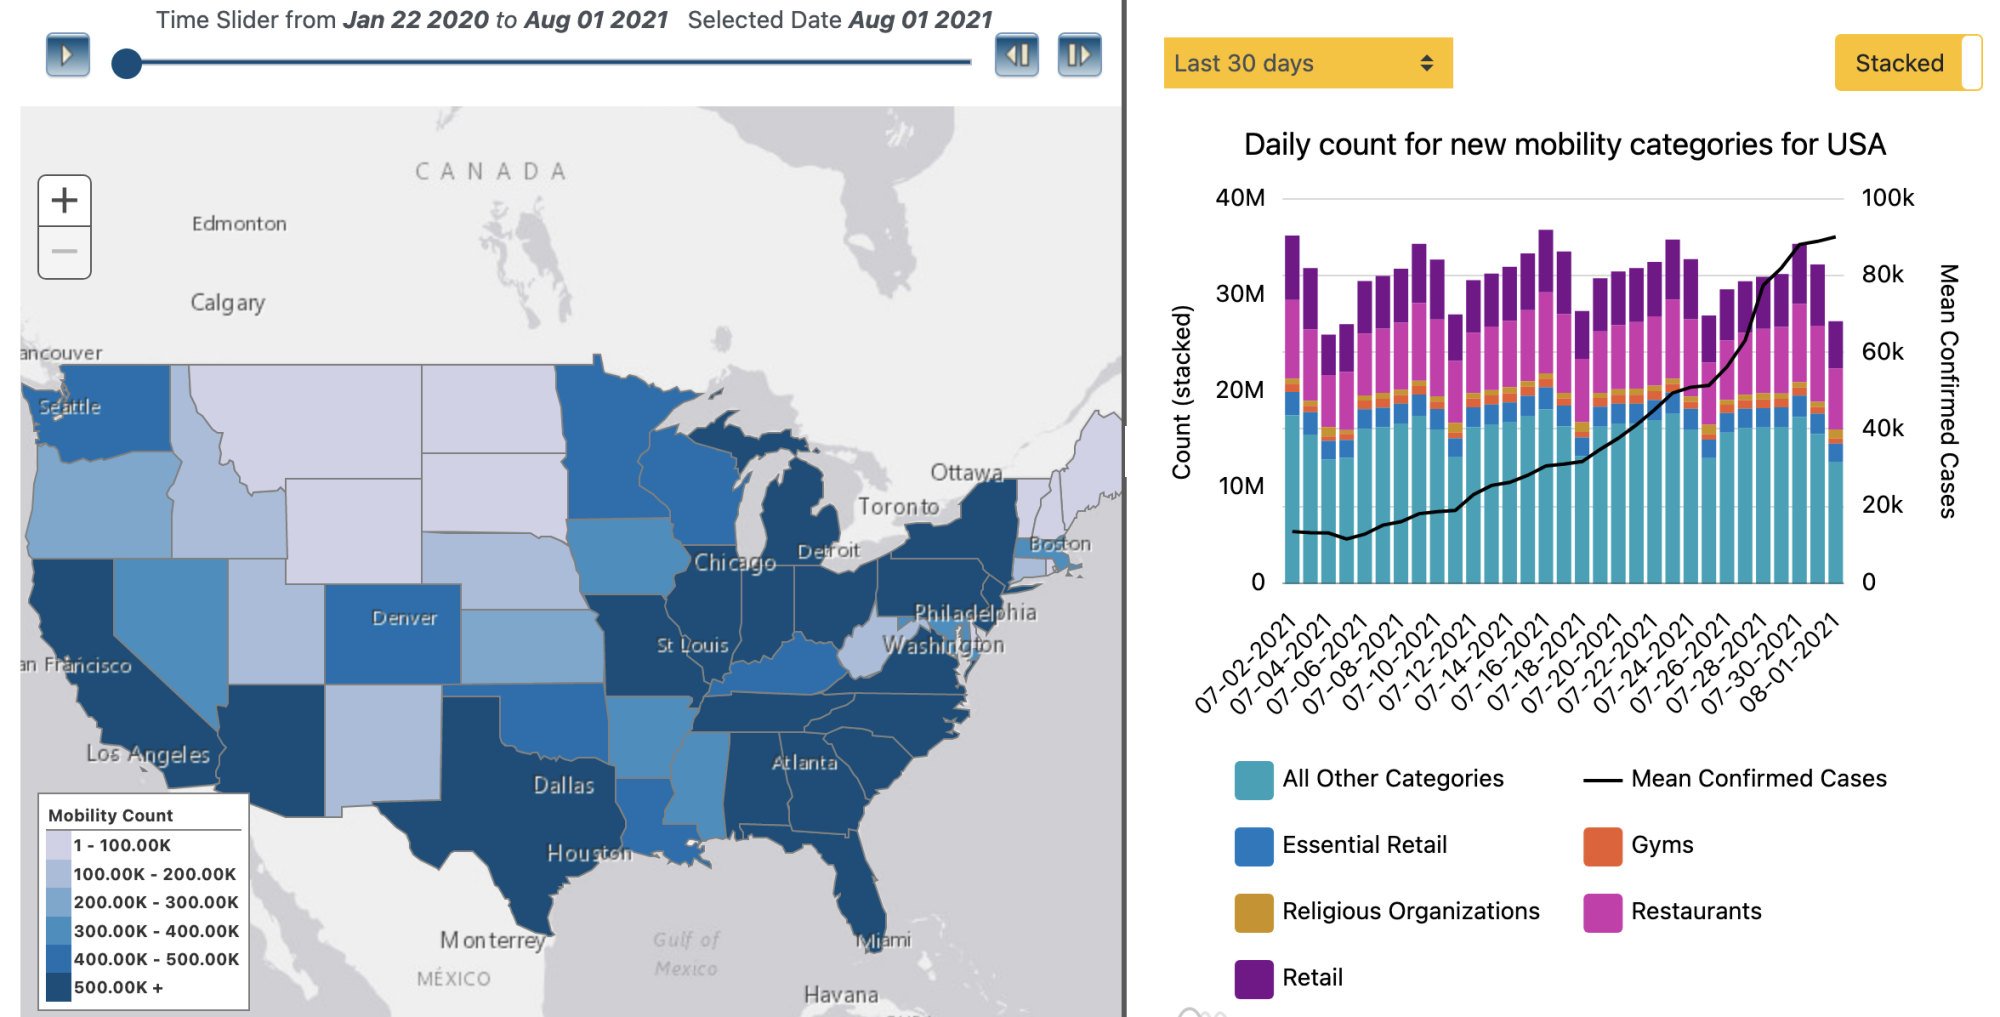 |
COVID-19 Mobility Surveillance Dashboard |
|
|
You can visit the COVID-19 Mobility Surveillance Dashboard here. |
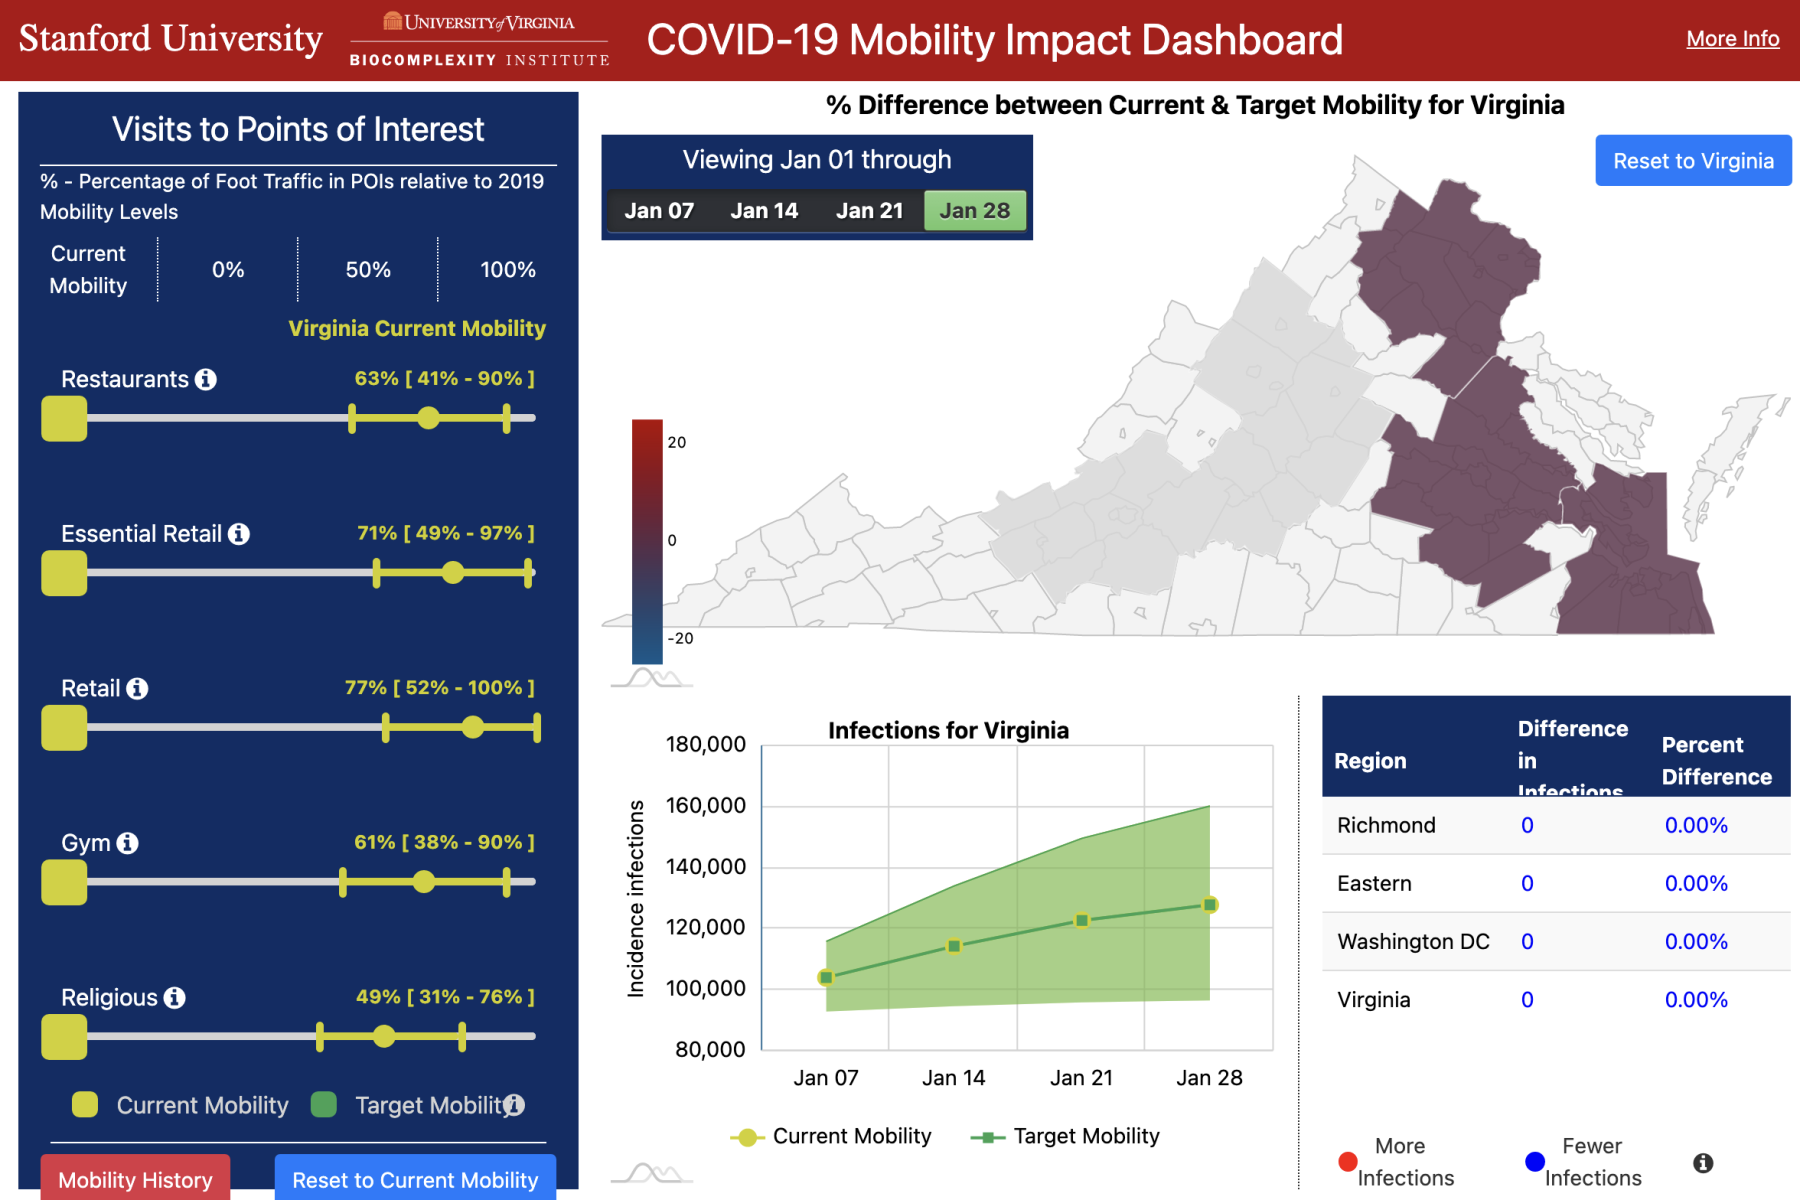 |
COVID-19 Mobility Impact Dashboard |
|
|
This dashboard is a decision-support tool that utilizes large-scale data and epidemiological modeling to quantify the impact of changes in mobility on infection rates. Our model captures the spread of COVID-19 by using a fine-grained, dynamic mobility network that encodes the hourly movements of people from neighborhoods to individual places, with over 3 billion hourly edges. You can visit the COVID-19 Mobility Impact Dashboard here, or learn more about it from our KDD’21 paper here. |
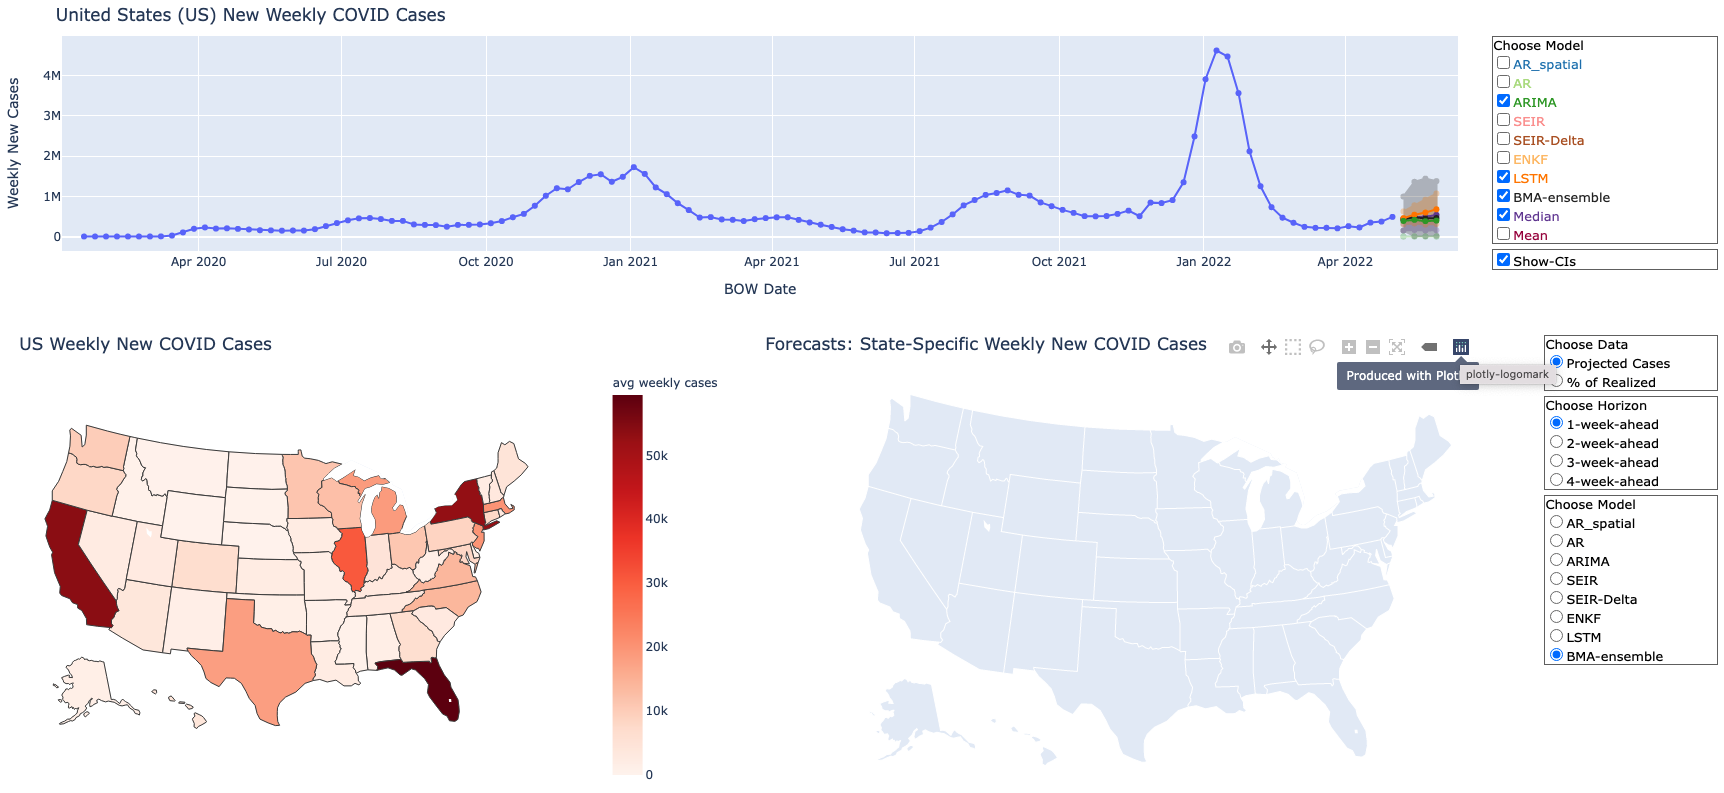 |
COVID-19 and Influenza Forecast Dashboard |
|
|
One of the challenges in analyzing data for public health response is the variety of analytical models available. This dashboard allows the user to compare models and thus provide a range of forecasts for COVID-19 and influenza. You can visit the COVID-19 and Influenza Forecast Dashboard here. |
|
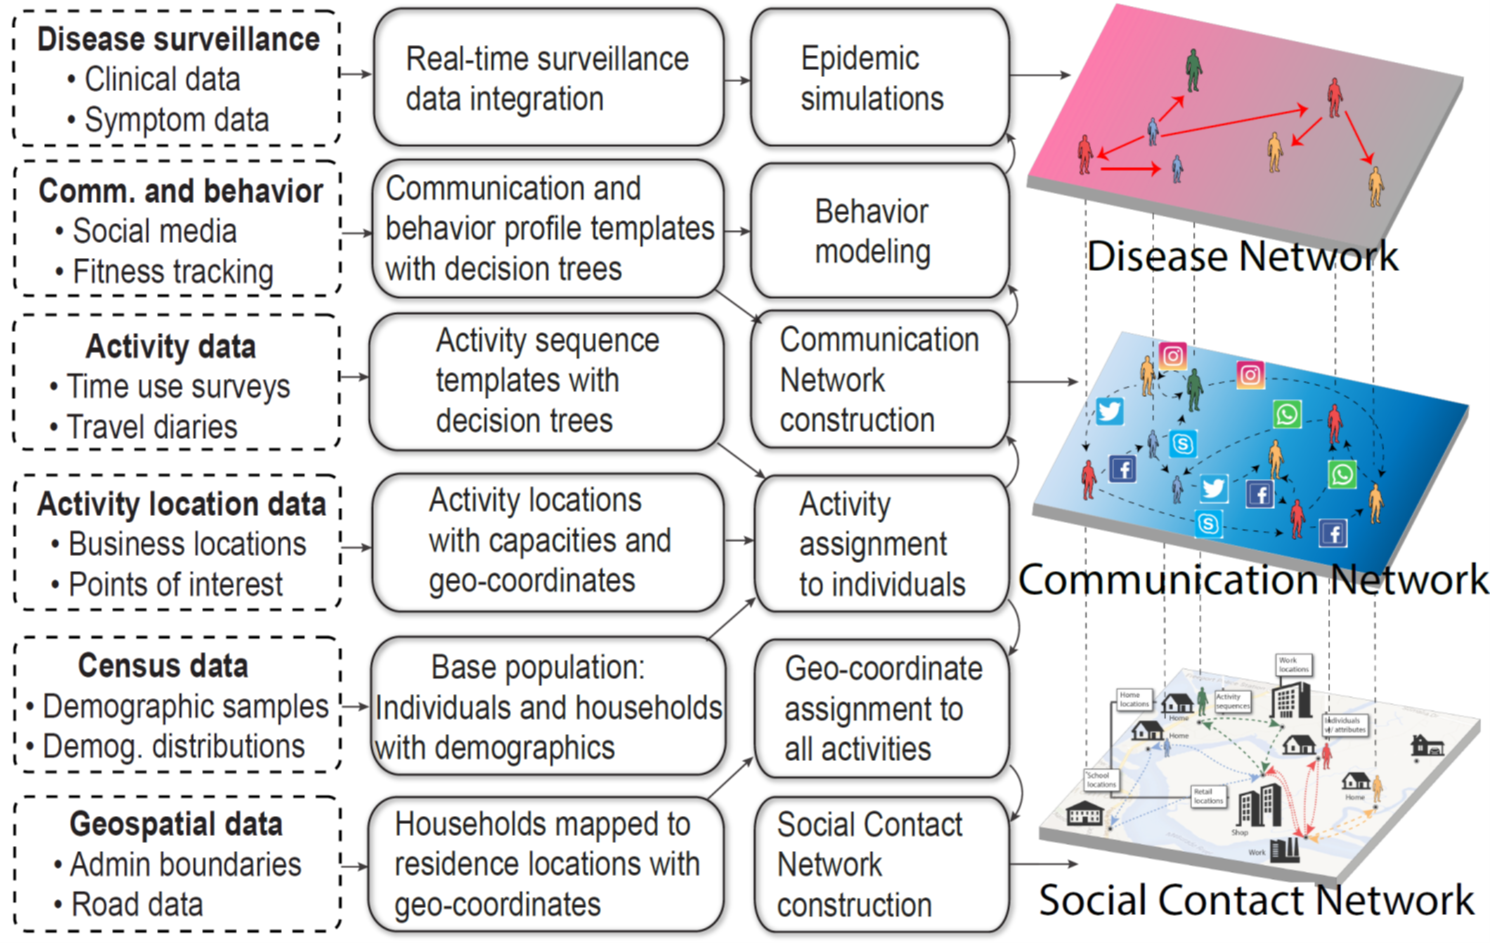
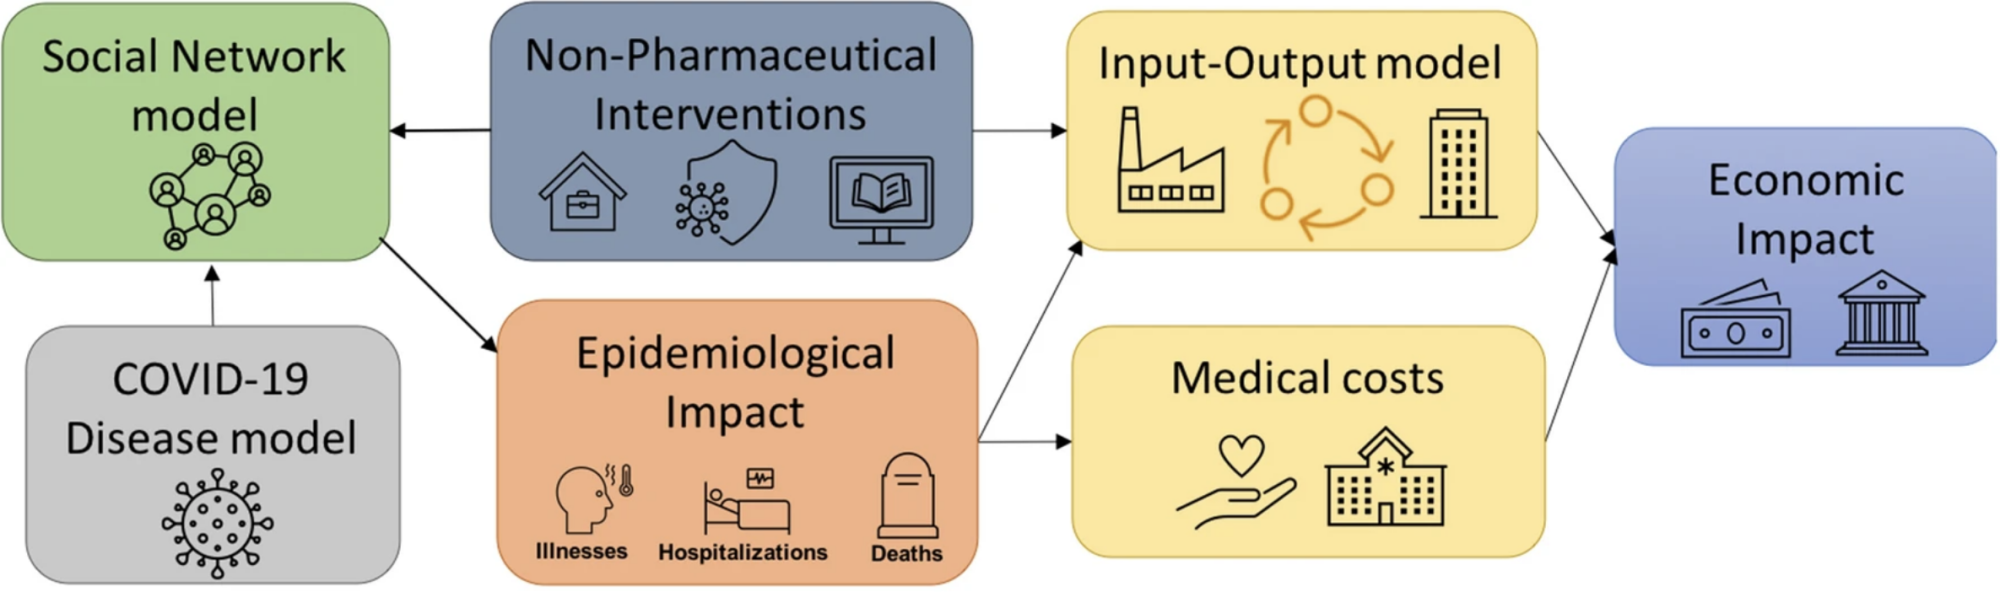
Building on our long-standing work on synthesizing social networks, we will develop new methods for estimating MSML networks. This estimation will operate on diverse global data sets; the team has developed strong relationships with multiple vendors to acquire novel data sets to achieve this goal. We will create open-source synthetic data sets, applications, and tools. Additionally, we have developed methods for using traditional administrative data sets — our initial research has led to global synthetic contact networks. This research will be extended using new sources of anonymized mobility data, electronic health records, and smart-device data, as well as real-time data pertaining to individual and community level awareness and behavioral changes. Some of these signals are voluminous, and parsing them through crowdsourcing would be expensive and time-consuming; carefully choosing a subset of the signals that can be parsed intelligently by the “crowd” is a novel stochastic optimization problem that generalizes standard PAC (probably approximately correct) approaches. Validation of such MSML networks is a challenge, which will be addressed by extending our earlier work. |
Schematic depicting synthesis of MSML networks from multiple data sources |